

| Operating Highlights | 2009 |
2008 |
Change (%) |
| Number of mobile customers (‘000) | |||
| Postpaid | 912 |
882 |
3.4 |
| Prepaid | 846 |
748 |
13.1 |
| Total | 1,748 |
1,630 |
7.9 |
| Market shares* (%) | |||
| Postpaid | 26.5 |
27.0 |
- |
| Prepaid | 24.9 |
24.3 |
- |
| Overall | 25.7 |
27.7 |
- |
| Singapore mobile penetration rate* (%) | 137.4 |
131.0 |
- |
| Average revenue per user (ARPU, S$ per month) | |||
| Postpaid (exclude Data plan) | 60.4 |
63.9 |
-5.5 |
| Data plan | 22.2 |
28.4 |
-21.8 |
| Prepaid | 15.2 |
17.3 |
-12.1 |
| Non-voice services as % of service revenue | 26.0 |
23.4 |
- |
| Minutes of use per active customer (MOU, minutes per month) | |||
| Postpaid | 356 |
352 |
1.1 |
| Prepaid | 250 |
199 |
25.6 |
| Total international retail minutes (million) | 727 |
526 |
38.2 |
| Average monthly churn rate (%) | 1.6 |
1.6 |
- |
| Acquisition cost per postpaid customer (S$) | 253 |
236 |
7.2 |
| Financial Highlights | 2009 |
2008 |
Change (%) |
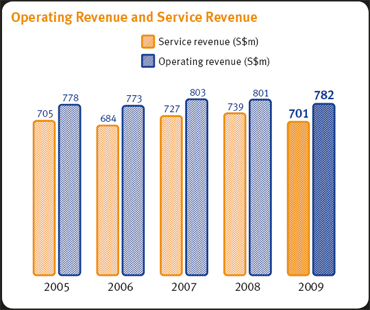
| Operating revenue (S$m) | 781.6 |
800.6 |
-2.4 |
| Mobile telecommunication services | 565.7 |
601.2 |
-5.9 |
| International call services | 128.4 |
137.1 |
-6.3 |
| Fixed network | 6.6 |
0.2 |
@ |
| Handset sales | 80.9 |
62.1 |
30.2 |
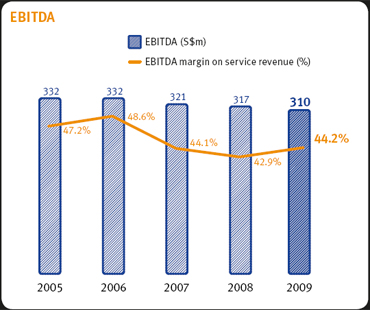
| EBITDA (S$) | 309.7 |
316.5 |
-2.1 |
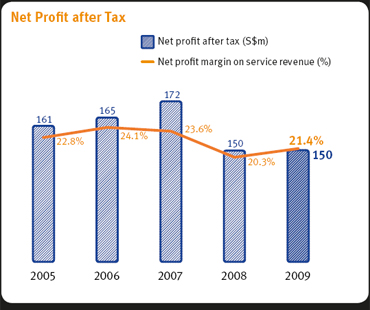
| Net profit after tax (S$) | 150.3 |
150.1 |
0.1 |
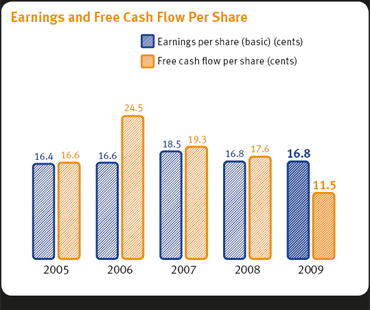
| Per share (cents) | |||
| Earnings (basic) | 16.8 |
18.8 |
0.0 |
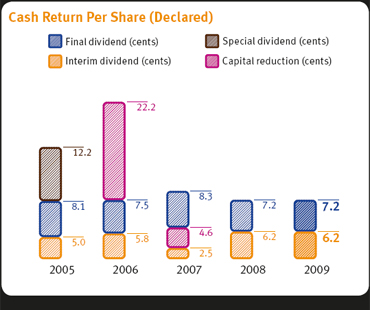
| Cash payout (declared) | 13.4 |
13.4 |
0.0 |
| Net assets | 28.6 |
24.9 |
14.9 |
| ROE (%) | 62.7 |
70.6 |
- |
| ROCE (%) | 31.4 |
32.8 |
- |