

By maximising operational efficiency and minimising the use of limited resources, M1 constantly works towards reducing its environmental footprint
of the water we consumed in 2017 was reclaimed water
reduction in average electricity consumption per base station vs. 2016
tonnes of recyclable e-waste collected
ENVIRONMENTAL FOOTPRINT (GRI 102-11, 302-4)
M1 recognises that sustainability is about ensuring that our actions today do not compromise the quality of life for future generations. All of our business operations abide by internationally recognised standards to help reduce or eliminate negative impact on the environment.
Power generated from non-renewable sources, such as grid electricity and fuel, as well as renewable sources, such as solar panels and NEWater, continues to be the main resource consumed in the provision of our services.
Electricity consumption
In 2017, our mobile networks, offices and data centre operations used 63,886,031 kWh of electrical power from Singapore’s power grid. Compared to 2016, this was only 0.1% higher, despite an 11% increase in new base stations deployed in 2017 to enhance coverage and support customers’ growing data needs. Our fibre networks’ electricity consumption for the year was 1,780,518 kWh, 4.1% higher than in 2016. This was due to an increase in customers and more subscriptions to a higher bandwidth plan.
M1’s retail operations used an estimated 349,537 kWh of electrical power in 2017, 0.4% lower compared to 2016, as the usage reduction from the closure of one M1 Shop retail outlet was offset by higher usage from an increased number of product display zones within some of the outlets. We are looking into using more energy-efficient lights to reduce our energy consumption.
Fuel consumption
We also operate three offshore base stations, at Pulau Satumu, Pulau Tekong and St John’s Island. These islands are not connected to the power grid, and therefore on-site diesel generators are required to provide power for the base station equipment. The three sites used 40,073 litres of diesel fuel in 2017, 18% lower than 2016. This reduction in fuel consumption was primarily driven by the replacement of three generators at Pulau Tekong with more efficient generators in December 2016. This project was completed in March 2017.
Our fleet of vehicles support our field engineers who are responsible for installing new mobile equipment, performing drive tests, and conducting site maintenance and repairs. In 2017, fuel consumption for our diesel vehicle fleet was 25,362 litres, 4.8% lower than the year before. This was achieved by encouraging more efficient driving habits, and adding four new and more fuel-efficient vans to the fleet in 2015. However, our petrol-powered vehicles consumed 11,678 litres of fuel in 2017, 3.6% more than the year before.
Water consumption (GRI 303-1, 306-1)
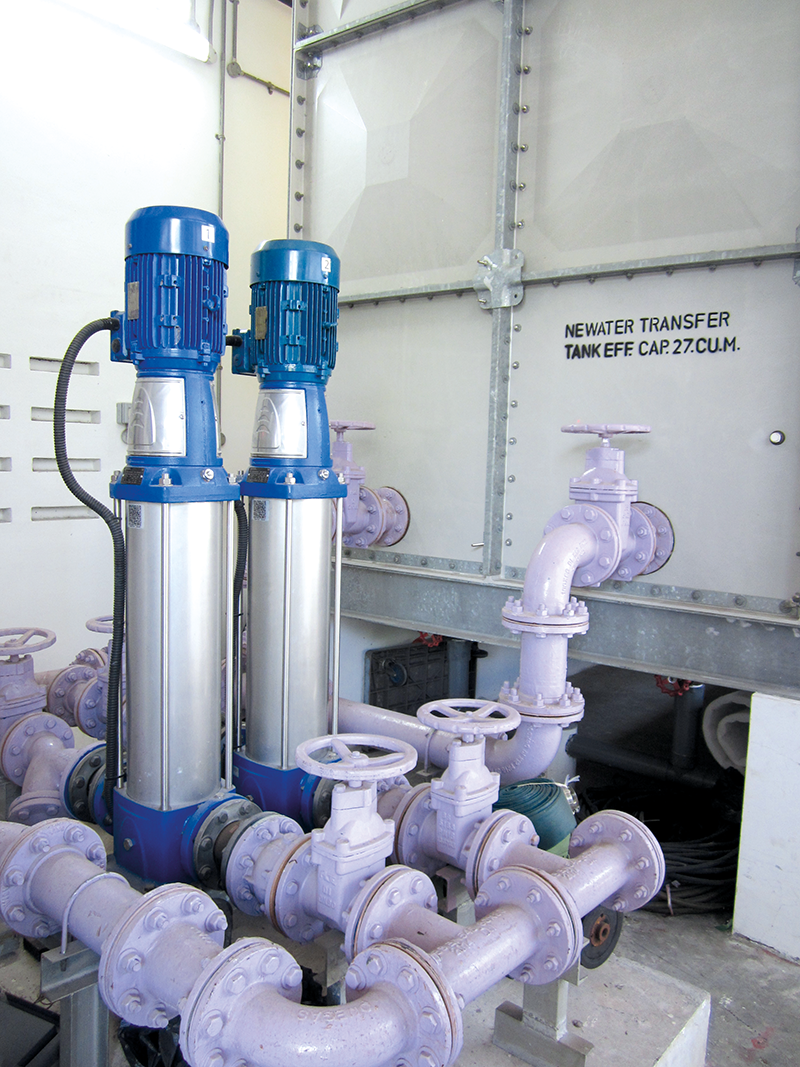
M1 uses potable water for daily activities at our offices and NEWater for equipment cooling purposes at our various sites, including our data centre (since 2015). NEWater is reclaimed water available in Singapore for industrial use and has a lower environmental impact.
In 2017, we switched more sites from the potable water network to the NEWater network, thereby reducing our consumption of potable water. Our total water consumption for the year was 63,196 m3, 3.6% more than in 2016. Potable water represented 77% or 48,633 m3 of the total, while NEWater represented 23% or 14,563 m3. In 2016, these figures were 80% or 48,735 m3 and 20% or 12,231 m3 respectively.
All of our used water is disposed through the city’s sewerage system. It is collected by the national water agency (PUB) and subsequently treated at water reclamation plants for purification and return to nature or reuse as NEWater (see www.pub.gov.sg for more details).
CONSERVATION MEASURES
We continually review our business operations to identify ways to reduce our impact on the environment while still increasing productivity and delivering consistent quality service to our customers. Our key efforts in recent years have focused on our networks, facilities and general operations.
Networks (GRI 302-4)
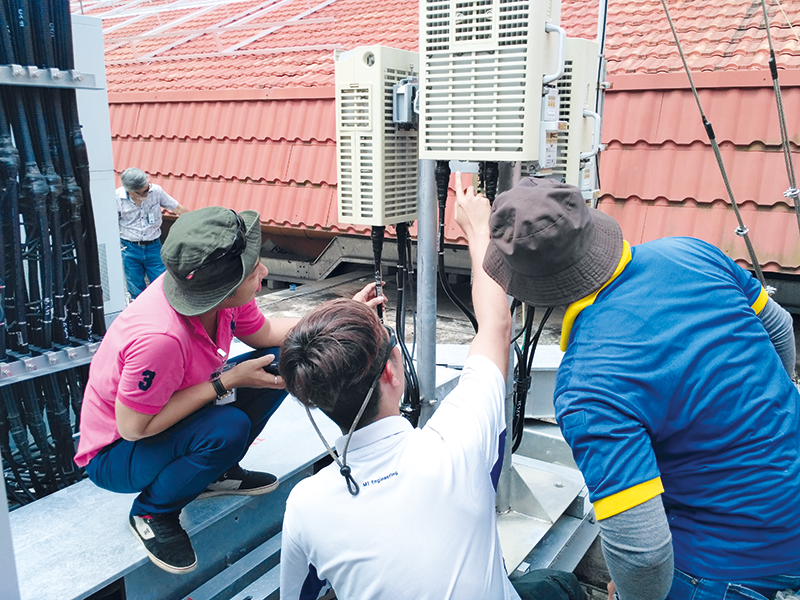
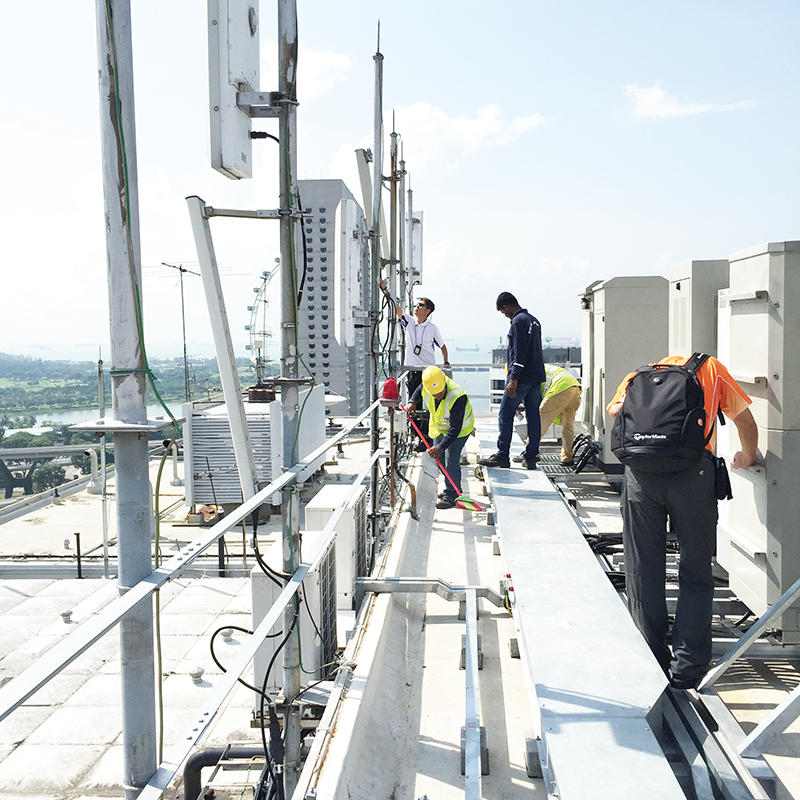
Our base station network, which enables us to deliver mobile voice and data services to our customers, accounts for approximately half of our energy consumption. We continually review our base station operations to identify ways to reduce energy consumption, including upgrading them with multi-radio units that do not require air conditioning. This has yielded annual power savings of 6,876,600 kWh.
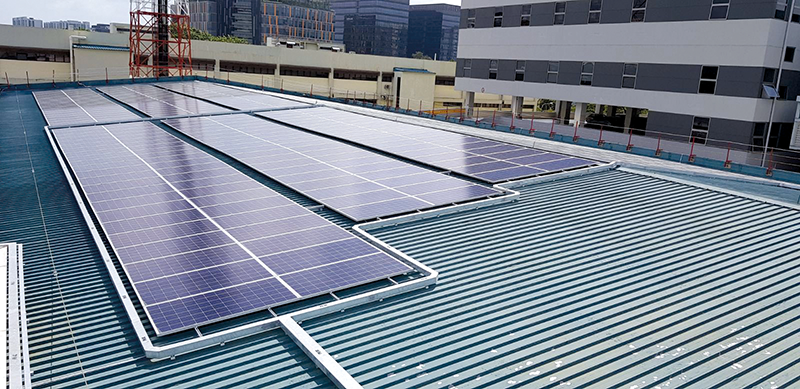
We deployed solar photovoltaic (PV) power systems to supplement the use of diesel power generators for our offshore base station sites on Pulau Satumu and St John’s Island, and this initiative has enabled us to reduce the use of diesel over the years. Although the terrain on Pulau Tekong does not permit the installation of solar PV power systems, the replacement of more efficient base station generators in March 2017 has reduced the site’s annual diesel usage.
Following a successful trial, small cells were deployed in 2016 at selected high traffic sites such as malls, libraries and MRT stations. Small cells enable us to enhance the mobile data throughput in a more targeted and energy-efficient manner, especially for indoor coverage. The roll out of small cells continued at other sites in 2017, resulting in a better data experience for customers with an increase in data traffic ranging from 17% to 150%. It also reduced battery drain on customers’ devices.
Facilities
M1’s 4,214 m2 five-storey annex building, sited next to our MiWorld building in Jurong, is fitted with environmentally-friendly features such as LED lights and rainwater harvesting tanks. The building, which has successfully achieved the Building and Construction Authority’s Green Mark Gold certification, also utilises reclaimed NEWater and condensate water, instead of potable water for cooling purposes.
In December 2017, we installed a 173 kW (Peak) solar PV power system on the roof of our Regional Operations Centre (ROC) that is capable of supplementing its energy consumption.
General operations
Our M1 Shop retail outlets are designed to enhance productivity and customer experience, as well as minimise our carbon footprint. In-store light fittings are LED where possible, and our streamlined transaction process using wireless tablets enables us to reduce the use of printed brochures, receipts, forms and other non-recyclable materials by an estimated 20% annually.
We use sustainably-sourced, environmentally-friendly Forest Stewardship Council (FSC) certified paper for all our printing needs. Through an e-billing programme, we have migrated all employees from paper to electronic bills and payment, and are progressively migrating our customers as well.
CARBON FOOTPRINT (GRI 305-1, 305-2, 305-5)
Based on our energy consumption, our carbon footprint in 2017 was 28,219 tonnes of CO2 equivalent (t-CO2e)6 . This consisted of 0.7% (202 tonnes) of direct emissions (scope 1)7 and 99.3% (28,017 tonnes) of indirect emissions (scope 2).
The solar PV power system at ROC is expected to generate about 16,000 kWh of renewable energy each month, to help reduce our carbon emissions going forward. The grid electricity saved by using this clean source represents a reduction in emissions of 81.5 t-CO2e per year.
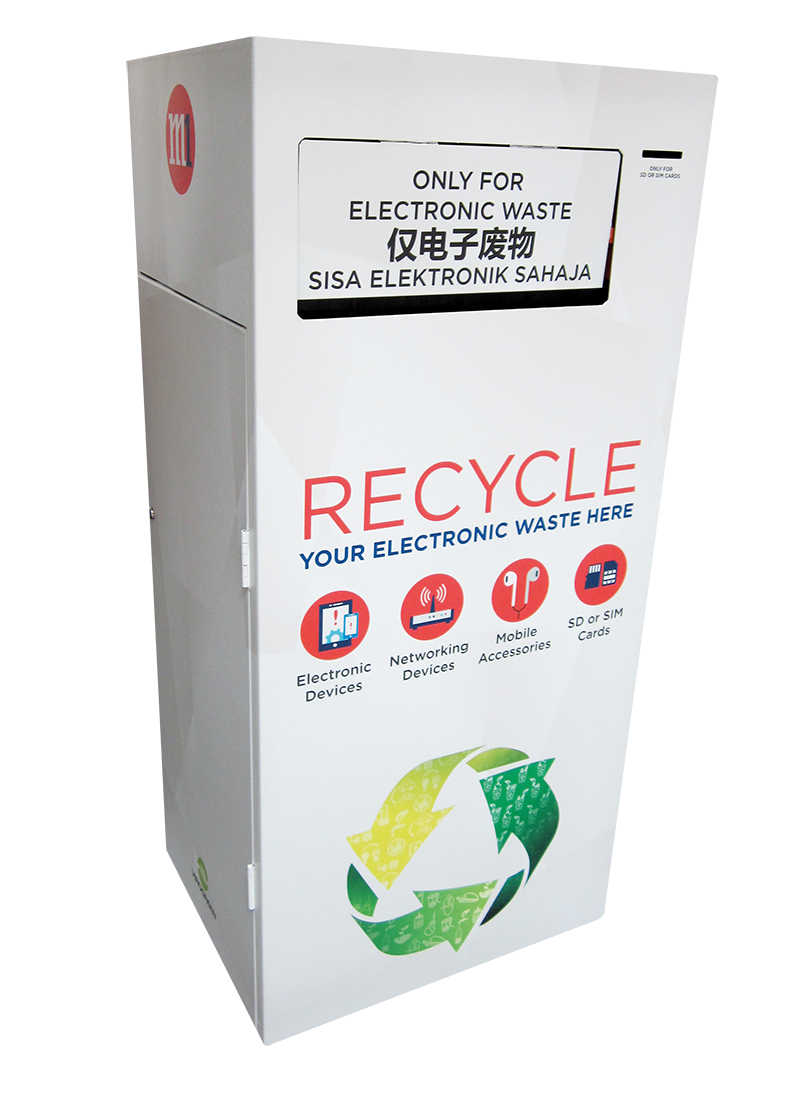
E-WASTE BINS
From April 2017, M1 has been a supporter of the National Environment Agency’s electronic waste (e-waste) recycling initiative. E-waste bins are available in our offices and M1 Shop retail outlets, to enable staff and customers to conveniently and responsibly dispose of their e-waste.
To better acquaint our staff with the importance of e-waste recycling and management, we held multiple e-waste recycling activities in 2017, such as an E-Waste Recycling talk and an E-Waste Recycling contest.
From April to end December 2017, we collected 3.3 tonnes of recyclable e-waste.
| Environmental performance8 | 2017 | 2016 |
| DIRECT ENERGY | ||
| Fuel consumption | ||
| Diesel (offshore base stations) | 40,073 litres | 48,774 litres |
|
25,362 litres | 26,635 litres |
|
11,678 litres | 11,273 litres |
| TOTAL DIRECT ENERGY (d) | 2,905 GJ | 3,273 GJ |
| SCOPE 1 EMISSIONS | 202 t-CO2e | 227 t-CO2e |
| INDIRECT ENERGY | ||
| Electricity consumption | ||
|
30,816,881 kWh | 30,835,554 kWh |
|
33,069,150 kWh (1,159 kWh) |
33,019,706 kWh (1,259 kWh) |
|
1,780,518 kWh | 1,710,483 kWh |
|
349,537 kWh | 350,847 kWh |
TOTAL INDIRECT ENERGY (i) |
66,016,086 kWh 237,658 GJ |
65,916,590 kWh 237,300 GJ |
| SCOPE 2 EMISSIONS | 28,017 t-CO2e | 27,975 t-CO2e |
| TOTAL EMISSIONS (SCOPE 1 + 2) | 28,219 t-CO2e | 28,202 t-CO2e |
| TOTAL ENERGY (d + i) | 240,563 GJ | 240,573 GJ |
| WATER | ||
| Water consumption | ||
|
48,633 m3 | 48,735 m3 |
|
14,563 m3 | 12,231 m3 |
| TOTAL WATER | 63,196 m3 | 60,996 m3 |
| 6 | Carbon dioxide equivalent (CO2e) is the unit to express the carbon footprint of different greenhouse gases. |
| 7 | Under the GHG protocol, scope 1 emissions are from sources owned or controlled by the organisation; scope 2 emissions are from sources not controlled or owned by the organisation but are a consequence of the activities of the organisation. |
| 8 | Energy and emissions calculations are based on DEFRA Greenhouse gas reporting – Conversion factors 2016. Grid emission factors are sourced from Singapore Energy Market Authority (EMA). |

