

Operating Highlights
| 2017 | 2016 | Change (%) | |
| Mobile Telecommunications | |||
| Number of mobile customers ('000) | |||
| Postpaid | 1,292 | 1,247 | 3.6 |
| Prepaid | 747 | 772 | -3.3 |
| Total | 2,038 | 2,019 | 1.0 |
| Market share1 (%) | |||
| Postpaid | 25.2 | 24.8 | – |
| Prepaid | 22.0 | 22.5 | – |
| Overall | 24.0 | 23.8 | – |
| Singapore mobile penetration rate1 (%) | 149.6 | 149.8 | – |
| Average revenue per user (ARPU, S$ per month) | |||
| Postpaid (excludes Data plan) | 55.8 | 58.0 | -3.8 |
| Postpaid (excludes Data plan and adjusted)2 | 48.7 | 50.3 | -3.2 |
| Data plan | 12.7 | 14.8 | -14.2 |
| Prepaid | 10.7 | 12.2 | -12.3 |
| Non-voice services as a % of service revenue | 55.7 | 54.0 | – |
| Average monthly churn rate (%) | 1.3 | 1.0 | – |
| Acquisition cost per postpaid customer (S$) | 404 | 369 | 9.5 |
| Fixed Services | |||
| Number of fibre customers ('000) | 189 | 160 | 18.1 |
| ARPU (Fibre, S$ per month) | 43.5 | 45.1 | -3.5 |
| 1 | Based on IMDA statistics as at November 2017 |
| 2 | After adjustment for ARPU allocated to handset sales |
Financial Highlights
| 2017 | 2016 | Change (%) | |
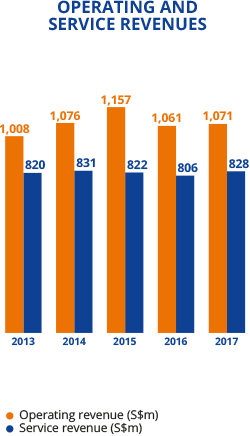
| Operating revenue (S$m) | 1,071.1 | 1,060.9 | 1.0 |
| Mobile telecommunications | 642.5 | 640.0 | 0.4 |
| International call services | 55.9 | 61.3 | -8.9 |
| Fixed services | 129.7 | 104.2 | 24.5 |
| Handset sales | 243.0 | 255.4 | -4.9 |
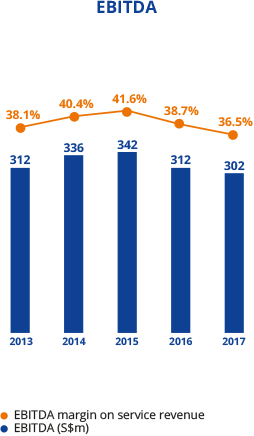
| EBITDA (S$m) | 302.4 | 312.1 | -3.1 |
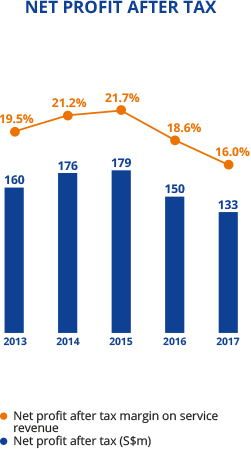
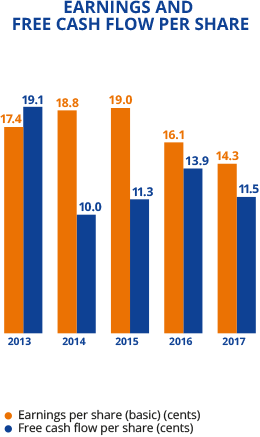
| Net profit after tax (S$m) | 132.5 | 149.7 | -11.5 |
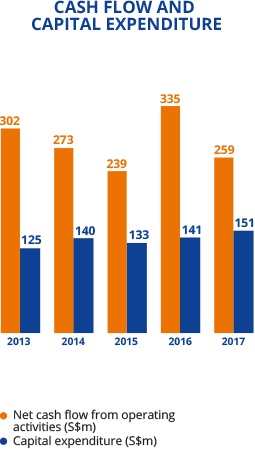
| Free cash flow (S$m) | 106.7 | 129.6 | -17.6 |
| Net assets (S$m) | 428.9 | 403.4 | 6.3 |
| Net debt (S$m) | 403.5 | 390.0 | 3.5 |
| Financial ratios | |||
| Net debt/equity (x) | 0.9 | 1.0 | – |
| Net debt/EBITDA (x) | 1.3 | 1.2 | – |
| EBITDA/interest (x) | 30.6 | 46.2 | – |
| ROE (%) | 31.8 | 36.7 | – |
| ROCE (%) | 16.9 | 19.9 | – |
Note: Figures may not add up due to rounding

